Issue
- I. Create a new Web control rule that logs blocked websites when visited by machines running an ESET Endpoint or ESET Server Security product
- II. Create a new Web control logs report template for blocked websites in ESET PROTECT
- III. Add new Web control logs Dashboard report
Solution
I. Create a new Web control rule
If you have already created a Web control rule and want to create a Dashboard report, change each rule's Logging severity to Warning (see step 7 below) and skip to part II.
-
Click Policies, select the desired Built-in policy, then select the policy that you want to modify and click Actions → Edit.
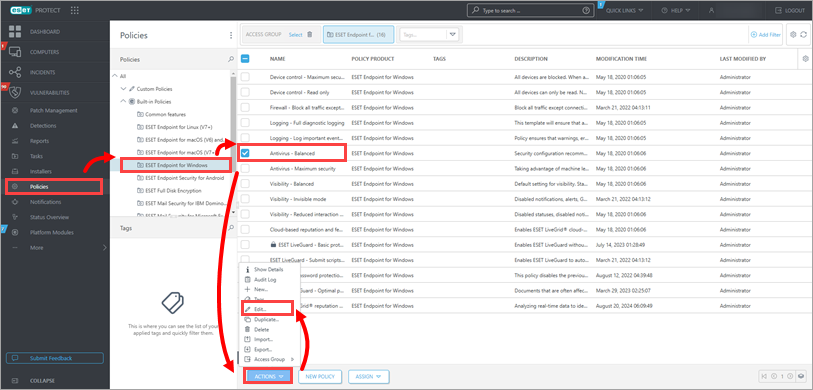
Figure 1-1 -
Click Settings → Protections → Web access protection, expand Web control, enable the toggle next to Enable Web control and next to Rules, click Edit.

Figure 1-2 -
Click Add (or select an existing rule and then click Edit to change the Logging severity).
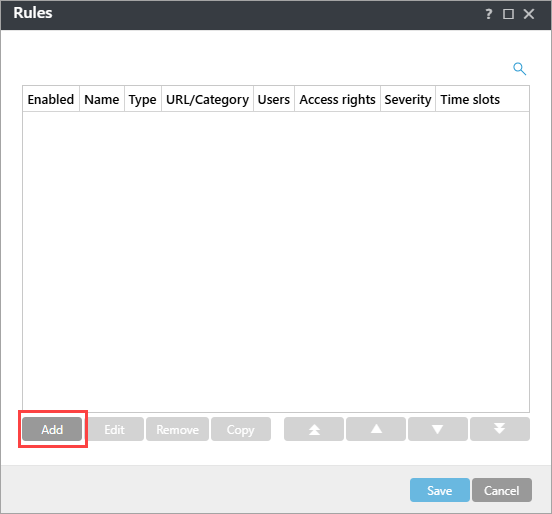
Figure 1-3 -
Type the name of the rule and select the appropriate settings for the rule (Type, Access rights). Type the URLs you want the rule to apply to.
-
In the Logging severity drop-down menu, select Warning and click Save.
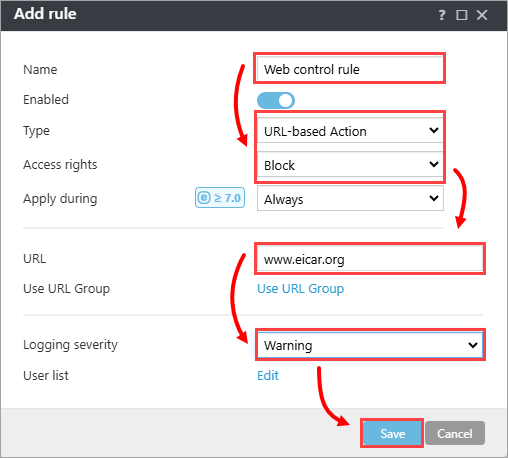
Figure 1-4 -
Click Save.
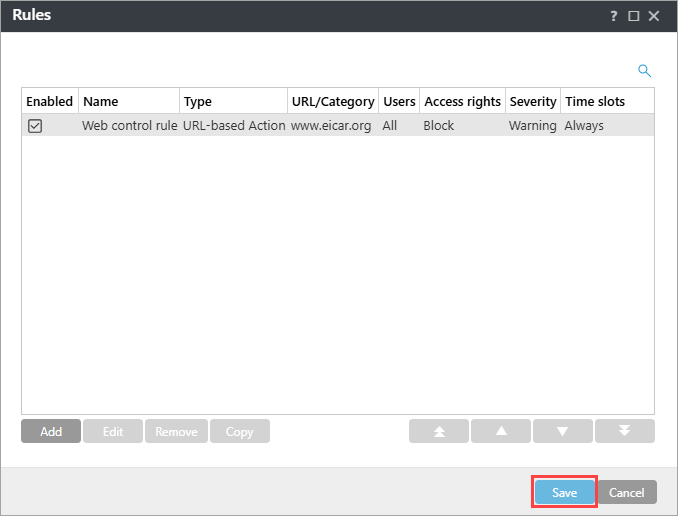
Figure 1-5 -
Click Finish.
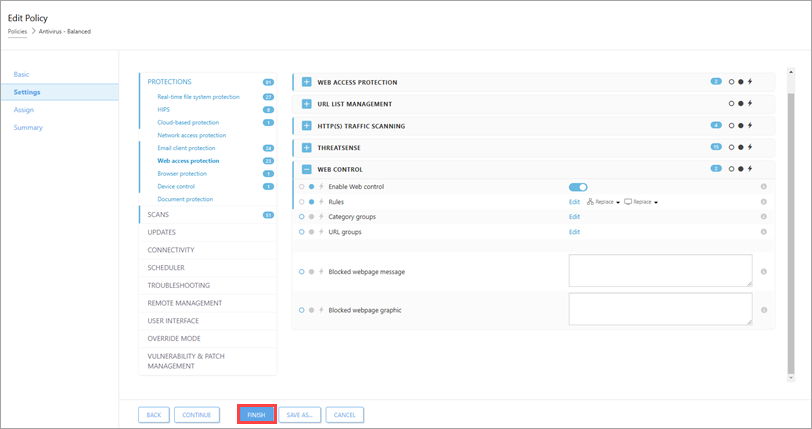
Figure 1-6 -
An error message appears anytime a client attempts to visit a URL blocked by Web control. Continue to Part II.
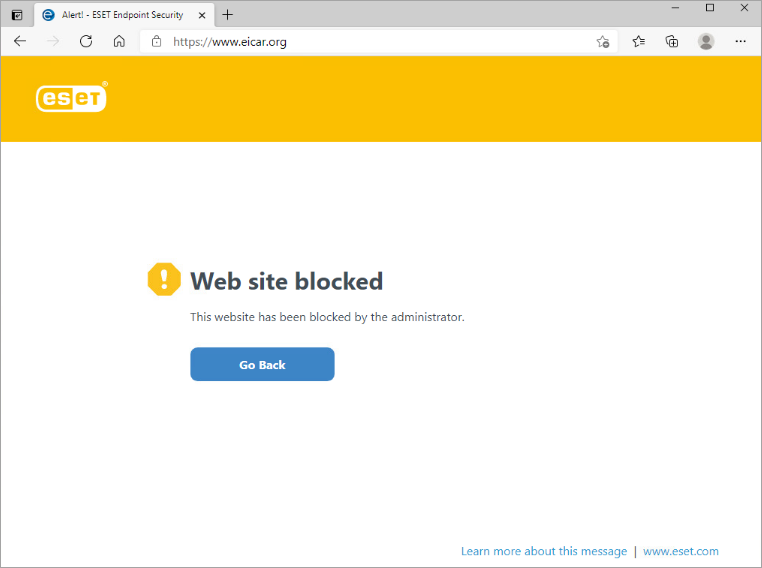
Figure 1-7
II. Create a new Web control logs report template in ESET PROTECT
-
Click Reports → New Report Template.
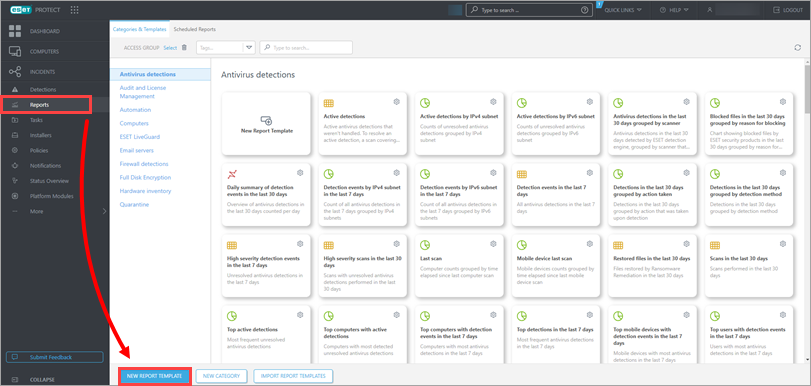
Figure 2-1 -
In the Name field, type a name for your report. Under Category, click No category selected.
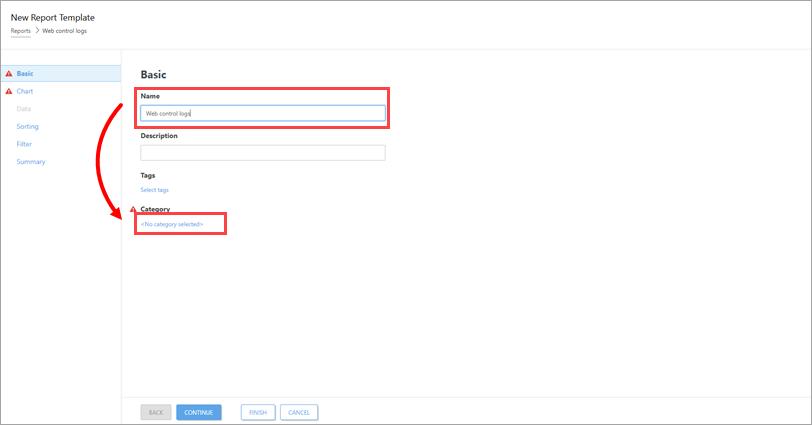
Figure 2-2 -
Select the check box next to the Computers and click OK.
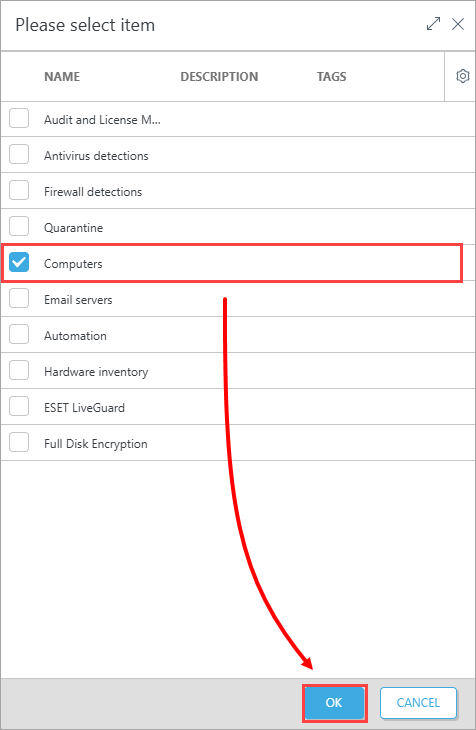
Figure 2-3 -
Click Chart. Select the check box under Display Table.
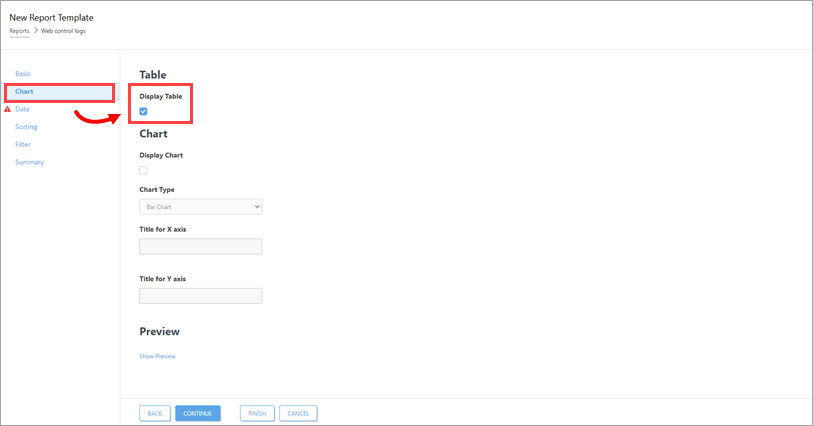
Figure 2-4 -
Click Data → Add Column.
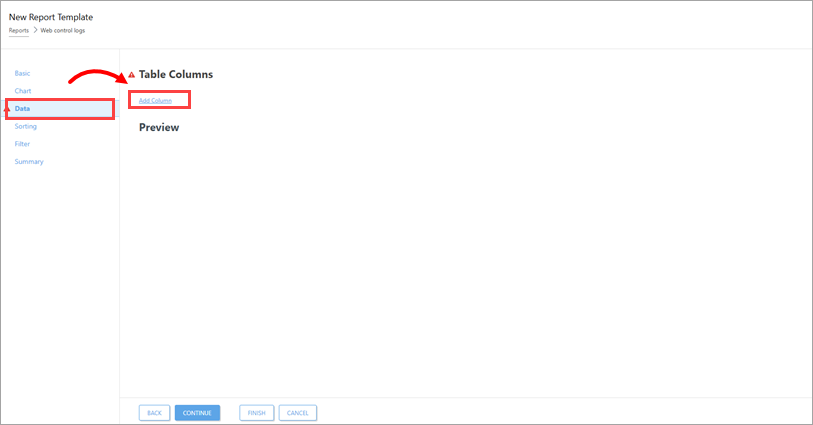
Figure 2-5 -
Expand the Computer → Computer category, select Computer name and click OK.
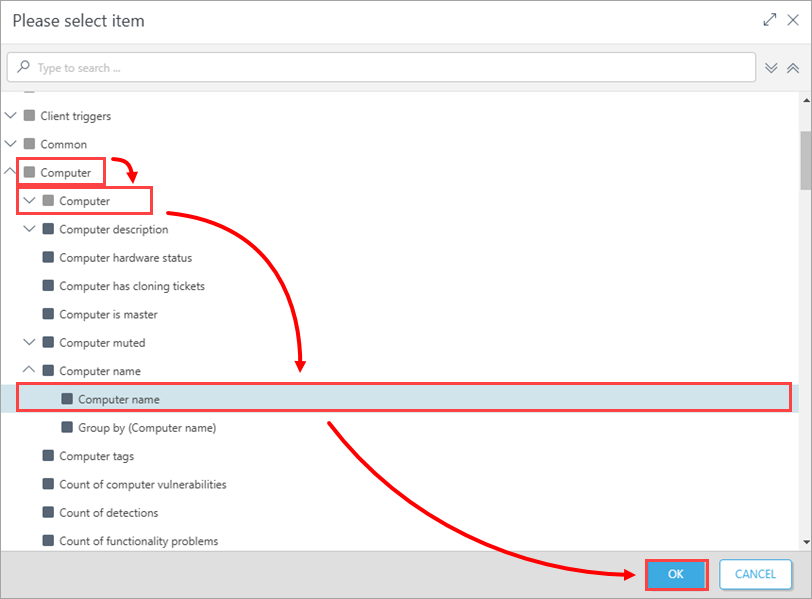
Figure 2-6 -
Click Add Column. Expand Web control → Action performed, select Action performed, and click OK.
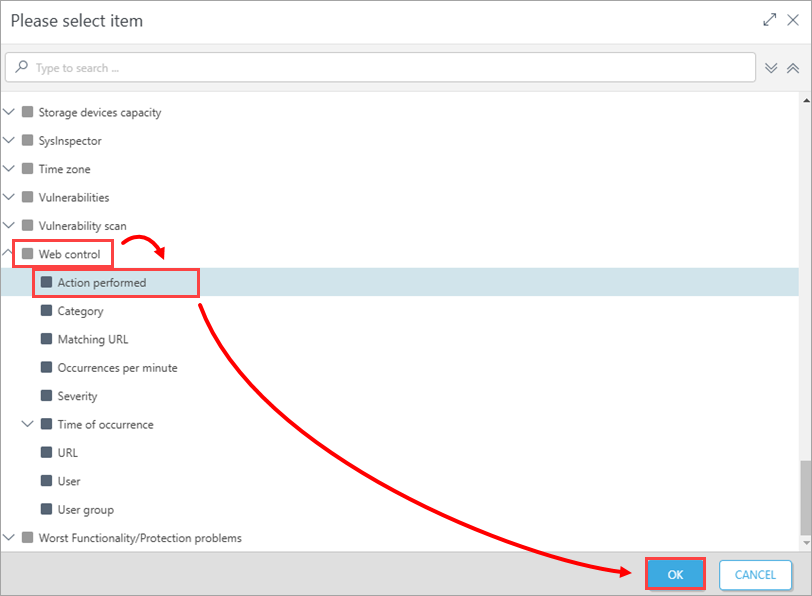
Figure 2-7 -
Click Add Column. Expand Web control → Category, select Category, and click OK.
-
Click Add Column. Expand Web control → Matching URL, select Matching URL, and click OK.
-
Click Add Column. Expand Web control → Time of occurrence, select Time of occurrence, and click OK.
-
Click Add Column. Expand Web control → User, select User, and click OK.
-
Click Finish.
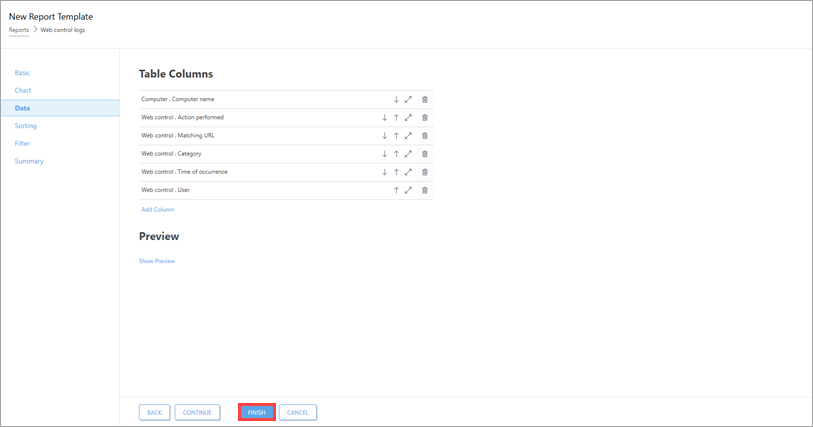
Figure 2-8
III. Add new Web control logs Dashboard report
-
Click Dashboard and click the plus icon to add a new dashboard.
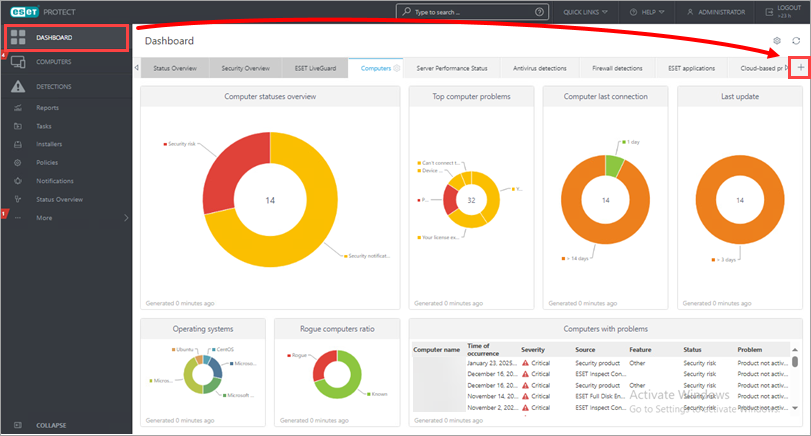
Figure 3-1 -
Type a name for your new dashboard and click Add Dashboard.
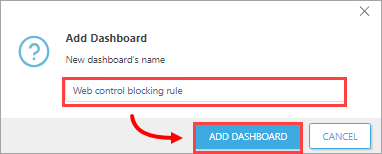
Figure 3-2 -
Click the plus icon.
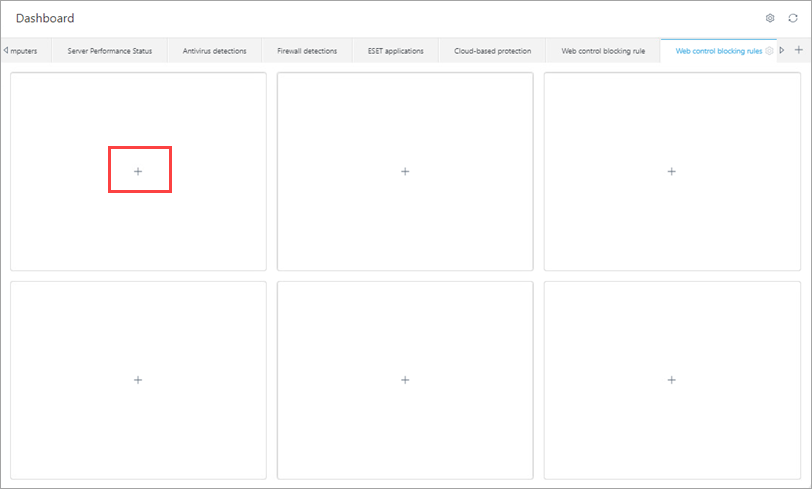
Figure 3-3 -
Select the report you created in Part II (in this example, Web Control Logs), and click OK.
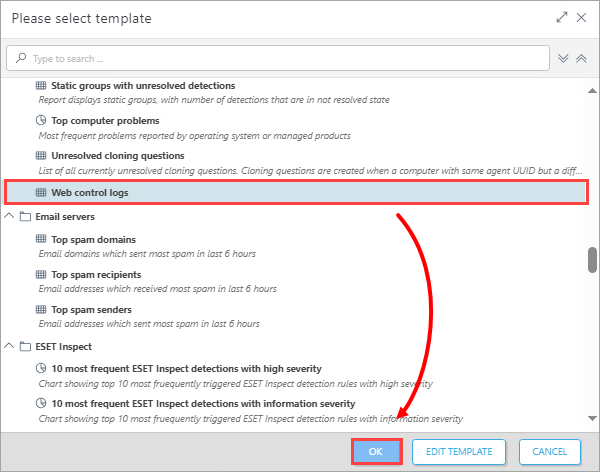
Figure 3-4 -
Your dashboard is now available. When a URL is blocked by Web control, each URL is listed in the new Dashboard report.
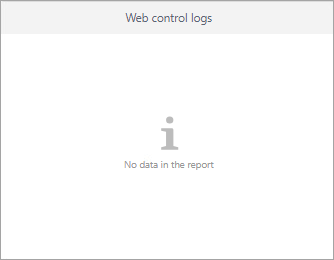
Figure 3-5